A log, not a sales pitch

I run finance for a living. I embarked on building the software too.

I'm a senior finance manager, not a developer. For years I signed off reports I knew could be better, specified exactly what we needed, and could not build a line of it myself. Then I started working with Claude. This page is the running log — what I've built, how it actually works, what it changed, and what I still get wrong.

The Story

I always knew what to build. That was never the problem.

Every finance function I have worked in had the same shape of problem, and none of them were mysterious. The payroll sheet someone inherited three years ago that nobody fully understood. The month-end close that ran eleven days because the numbers lived in four places. The board pack rebuilt by hand every period because no system produced the view anyone actually wanted.

I could see the fix every time. I could specify it in a sentence. What I could not do was build it. Software was something you bought at enterprise prices, waited two quarters for IT to scope, or spent years learning to write yourself — and none of those were available to the person accountable for closing on time.

So the fixes stayed as requirements documents. Business cases that never cleared the threshold. Spreadsheets that treated the symptom and not the cause, because a spreadsheet was the only thing I could build with my own hands.

The bottleneck was never the idea. It was the distance between the idea and a working thing.

What changed is not that I learned to code. It is that I found something that could hold a technical conversation with me in the language I already spoke — the language of the problem. I could say this needs to handle semi-monthly cutoffs, and the employer share matters as much as the employee share, the way I would brief an analyst, and get back something that ran.

The first thing I built that way took an afternoon. It replaced a process that had been quietly wrong for two years — the kind of thing I would previously have raised, documented, and watched sit in a backlog. Not because the AI was clever, but because for the first time the distance between knowing and shipping was short enough to cross in one sitting.

Everything below came out of the four weeks since. The tools are real, they are in use, and most of them are free. What I want to show is not that AI can write code — you already know that. It is what becomes possible when the person who understands the problem is finally the same person who can build the answer.

The Log

Where It All Began

Every date below is real, taken from the files themselves. I am not claiming this pace is normal — I am saying it is what happened, and that none of it required a course. If you are earlier on this road than I am, the dates are the useful part.

  1. 28 July 2026

    Day one

    I opened Claude for the first time with no plan beyond finding out what it could do. I keep the books and close the month; I had never shipped a line of software in my life.

  2. 30 July 2026

    Two days in, I started the hard one

    An attendance system for remote teams: Postgres, an ASP.NET Core API with tokens and role-based access, a real-time hub, a React dashboard, and a Windows tray agent that detects idle time and queues its data offline when the network drops. Built deliberately as a vertical slice — prove the architecture end to end first, then fill in the surface, rather than scaffolding a half-finished enterprise product. It is also the one where I wrote a data-privacy audit and got a legal review before finishing the features, because software that watches people work is not a neutral thing to build. Still in progress.

  3. 1 August 2026

    The first tool, four days in

    A payroll calculator handling the statutory tables correctly, then the advanced workbench behind it — overtime, holiday pay, loan deductions, a breakdown I could defend to an auditor. Both still live, both free.

  4. 5 August 2026

    Eighteen sheets that agree with each other

    A multi-store retail operations system — allocations, receiving, sales, returns, live stock on hand. The hardest thing I have built, and the one that taught me most about verifying rather than trusting.

  5. 11–21 August 2026

    Two extractors, eleven days

    A Windows app that reads vendor invoice PDFs into a register, and — overlapping it — a full-stack web app that watches a mailbox for receipts and puts them through the same discipline. Extraction was never the hard part. Knowing when not to trust it was: every field carries a confidence score, anything doubtful lands in a review queue instead of quietly entering the books, and both are measured rather than assumed — the invoice tool against a frozen baseline of two identical runs over eighteen real invoices, the receipt scanner against a test suite that asserts money never touches a floating-point number. Both shipped with manuals, because a tool only I can run is not finished.

  6. 20–26 August 2026

    I built Claude a new tool

    A local server that gives Claude control of the Power BI report layer — pages, visuals, layout — from plain English. It runs entirely on the machine: no cloud API, no service principal, no keys. It also refuses to write while Power BI Desktop has the file open, because Desktop rewrites the whole file when it saves and would quietly discard the edit; better to decline than to lose someone's work. Fifty source files, twenty test files, packaged as an installable plugin. The strangest part of the month: a thing I built is now part of how I build.

  7. 22 August 2026

    Four industries in one afternoon

    Dental, café and bar, restaurant, salon and wellness — four complete financial reporting packs, first file saved at 14:16 and the last at 16:30. The lesson was templating: the accounting is shared, the operating drivers are not, and getting that boundary right is the whole job.

  8. 26 August 2026

    Power BI, in both directions

    Rebuilt a finished dashboard from nothing but a screenshot, then built a seven-page report from an empty file with a custom theme across every page. Taking one apart, then proving I had learned it.

  9. 26 August 2026

    This page

    Written and built the same day — itself an example of the method it describes.

  10. 27 August 2026

    The first tools that ran without me

    Three people asked for the payroll template and I did not notice for days. The fix was not to reply faster — it was to stop being in the loop: the template now downloads the moment someone asks, and the form tells me afterwards. Same day I found a mobile layout bug that had been live since launch, which I caught by measuring the page rather than looking at it.

  11. 28 August 2026

    The report where the data fought back

    A five-page HR report built from six raw CSV files — the first one where cleaning the data took longer than building the visuals. Currency stored as text, a stacked two-row header, three files describing the same 310 people and disagreeing about one of their birthdays. The part I keep thinking about is the status field that labels eleven employees "Future Start" who were hired in 2015 and have since had performance reviews: build headcount on it and you are short by eleven, confidently, forever. Every measure was checked against live data before it went on a page, and the defects that survived are written into the documentation rather than left for whoever inherits it.

  12. Next · 30 August to mid-September 2026

    The bookkeeper skill

    The two extractors get documents into the books. This one is the method itself, packaged so it can be handed to someone else and run without me in the room — which is the only version of any of this that actually scales.

How I Work

What working with Claude actually looks like

Not prompts and magic. Five habits that decide whether you get something you can ship or something you have to throw away. If you are trying to do this yourself, this is the section that matters.

01

Bring the problem, not the specification

The instinct is to arrive with a feature list. The better opening is the situation: who is stuck, what they do today, what goes wrong, what "fixed" would look like on a Tuesday afternoon. Every tool here got materially better the moment I stopped describing the solution I had half-designed and started describing the mess it came from.

02

Brief it like a capable colleague, not a search box

Context that would matter to a new hire matters here too — the statutory table that changed this year, the client who insists on seeing employer contributions, the fact that this file gets opened on a laptop in a stockroom. Detail that feels excessive is usually the detail that prevents a plausible-looking wrong answer.

03

Build in pieces small enough to check

One sheet. One calculation. One screen. Then verify it against something you already trust — a payroll run you did by hand, a filed return, a stock count you personally supervised. A large build accepted on faith is a large build you cannot defend when someone questions a number.

04

Make the work show its reasoning

Ask for the arithmetic, not just the total. Every workbook I ship has a checks tab; every calculator shows its breakdown line by line. Partly that is for the user, and partly it is so I can find the error myself — because there will be one, and finding it is my job, not the tool's.

05

Own the output completely

When a business runs payroll on something I built, "the AI wrote that part" is not a defence and was never going to be. I read what gets produced, I test it against real figures, and I am accountable for what it does. That responsibility is the price of the speed, and it is a fair one.

Projects

Real things, in use

Each started as a problem someone described out loud. The note on every card says plainly which part was mine and which part was Claude’s.

Developer ToolLive

Power BI Visual MCP

A local server that lets Claude build Power BI report pages — visuals, layout, formatting — from plain English. Entirely on-machine: no cloud API, no service principal, no keys. Deliberately owns only the report layer, because Microsoft already ships a server for the data model and duplicating it would add risk for nothing.

Mine: the rule that it refuses to write while Power BI Desktop holds the file — Desktop would silently discard the edit, and losing someone's work quietly is worse than declining loudly. Claude: the server, the schema handling and seventy source and test files.

Installable plugin — not yet public
Web AppLive

Receipt Scanner

Watches a mailbox for receipts, pulls the text straight out of digital PDFs rather than photographing them, validates and de-duplicates, and stores everything in SQL Server behind a React review UI. Nothing is auto-approved on a guess — anything doubtful arrives in a queue with the original document beside the extracted fields.

Mine: the rule that money never touches a float — exact decimals from database to API, because 481.60 becomes 481.60000000000002 the moment it is a JSON number. Claude: the pipeline, the SQL job queue and the tests that enforce it.

Internal tool — not distributed
Desktop AppLive

Vendor Invoice Extractor

Reads vendor invoice PDFs into a register and a matching line-item file — fourteen fields, a subtotal-plus-tax reconciliation check, per-field confidence scoring, and a review queue for anything it is not sure about. Packaged as a Windows app with an operator manual.

Mine: deciding what a wrong number would cost, and designing the review queue around that. Claude: the extraction engine, the confidence model and the regression harness.

Internal tool — not distributed
Full StackIn Progress

Remote Attendance System

A workforce attendance platform — API, real-time dashboard and a Windows tray agent that survives losing its connection by queueing locally. Scoped as a vertical slice on purpose: prove every layer talks to the next before building the feature surface on top of guesses.

Mine: deciding what a tool that monitors people is allowed to collect — the privacy audit and legal review came before the features. Claude: the architecture, the auth model and the offline queue.

In progress — not distributed
Web AppLive

Philippine Payroll Calculator

Net pay for monthly and semi-monthly cutoffs — statutory contributions, withholding tax, and the employer share most calculators quietly omit. Runs in the browser, free, no sign-up.

Mine: the statutory tables, the cutoff logic, every figure checked against real payroll runs. Claude: turned it into working software in an afternoon.

Open the calculator
Web AppLive

Advanced Payroll Workbench

The full computation sheet — overtime, holiday pay, loan deductions, per-cutoff pay items — with a line-by-line breakdown you can hand to an auditor without apologising for it.

Mine: knowing which edge cases actually bite at month-end. Claude: the structure that made them all fit on one screen.

Open the workbench
Operations SystemLive

Multi-Store Retail Operations System

Eighteen linked sheets running allocations, receiving, sales, returns and live stock on hand across concept stores, beach clubs and pop-ups — with sell-through, best sellers and auto-ranked reorder alerts.

Mine: how stock actually moves between a Manila warehouse and nine outlets. Claude: the engine that keeps every sheet in agreement.

Download it free
Excel SystemLive

Financial Reporting Packs

Four industry workbooks — dental, café and bar, restaurant, salon and wellness. Paste one trial balance and 24 months of statements, variance analysis and KPI dashboards recalculate themselves. No macros.

Mine: the chart of accounts, the industry drivers, the materiality thresholds. Claude: the formula architecture holding thirteen linked sheets together.

Download them free
Power BIIn Progress

Power BI, learned by rebuilding

Teaching myself Power BI by taking a screenshot of a finished dashboard and working backwards to the model, relationships and DAX underneath it — then rebuilding until my version matched the picture.

Mine: reading what the visuals implied and judging whether the rebuild was actually right. Claude: the DAX, the star schema, and explaining why each choice followed.

See the dashboards
Power BILive

HR Analytics Report

Six raw CSV extracts into a five-page HR report — headcount, attrition, pay bands, recruiting cost and production performance — on a nine-table model with 48 measures, every one of them written up in plain language alongside its DAX.

Mine: refusing to trust the source's own status field once the dates contradicted it, and insisting the data-quality defects were documented rather than smoothed over. Claude: the Power Query cleaning, the star schema, the 48 measures and the write-up.

Download the report and the write-up
WebsiteLive

This page, and the site around it

Hand-built, no page builder, no template licence. Worth saying out loud: the thing you are reading is itself an example of the method it describes.

Mine: the story, the structure, every claim on the page. Claude: the markup, the layout system, and catching the bugs I would have shipped.

You’re looking at it
Dashboards

Power BI, learned in both directions

A monthly reporting pack tells you what happened. A dashboard lets someone ask the next question without waiting for me. I learned it two ways — by taking a finished report apart, and then by building one from nothing.

First, backwards: reverse-engineering from a screenshot. I started from an image of a finished dashboard — no data file, no model, no measure list. Working from the picture alone, we reasoned back to what had to sit underneath it: the tables those visuals imply, the relationships those tables need, the DAX each card and chart must actually be computing. Then I rebuilt it and compared the result against the original, panel by panel, until they agreed.

Then forwards: building from scratch. Taking something apart teaches you how it works. Building the next one from an empty file is where you find out whether you actually learned it — including the parts nobody screenshots, like a theme applied consistently across seven pages. The HR report went further back still: it starts at six raw CSV files, so the cleaning, the star schema and the derived columns had to be argued for before a single visual existed.

Neither is a tutorial. You are looking at a finished thing and working out what it is made of, or starting from a blank page and defending every choice — and both transfer to the next problem in a way that following button-presses never did.
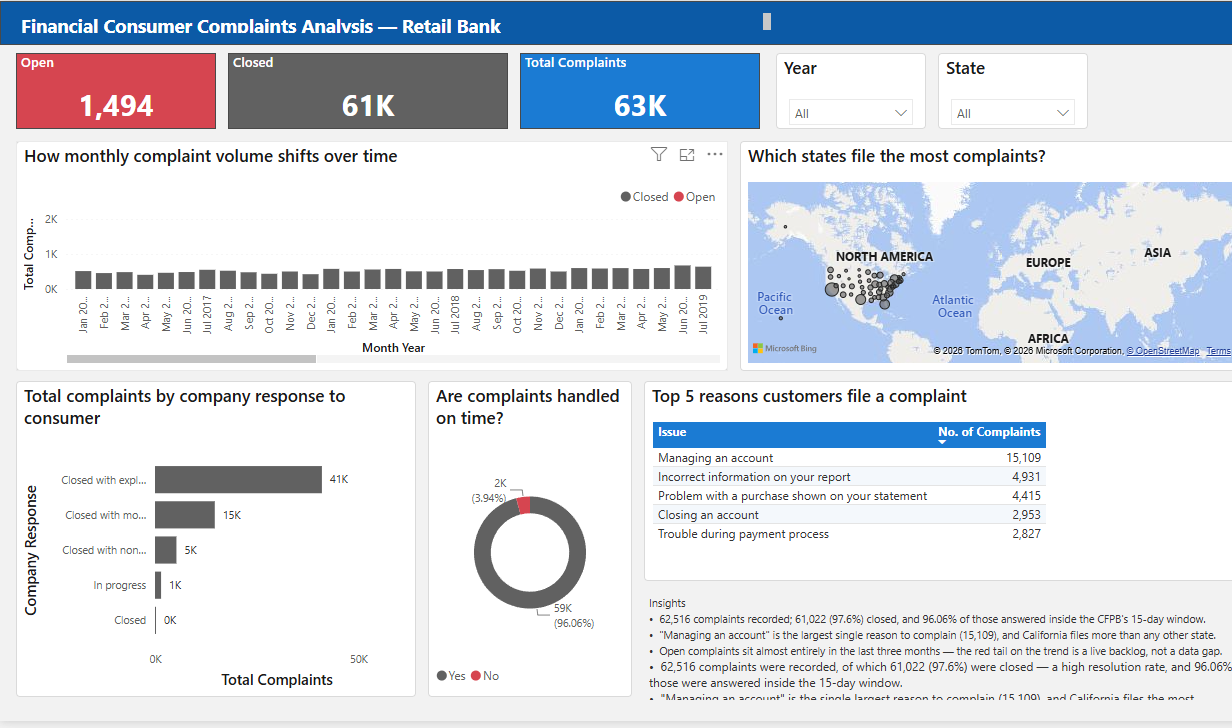
Power BI dashboard titled Financial Consumer Complaints Analysis for a retail bank, showing open, closed and total complaint KPI cards, a monthly volume trend split by status, a map of complaints by US state, a breakdown by company response, a timeliness donut, and a table of the top five complaint reasons. View full size

Financial Consumer Complaints Analysis

The question: where are complaints coming from, what are they actually about, and are we closing them fast enough?

Not my design. This is a reconstruction of a dashboard by Somel Eraño Chan, rebuilt from a screenshot of their published case study to teach myself Power BI. Working from the image alone: 62,516 complaints on public CFPB data, a KPI row, monthly volume split by status, complaints by US state, company response, timeliness against the regulator's 15-day window, and the top five issues. Every table, relationship and measure had to be inferred from what the visuals were doing.

Credit: original dashboard and analysis by Somel Eraño Chan — the design and the analytical thinking are theirs, the reconstruction is mine. Their case study is worth reading in full.

Power BIDAXStar SchemaCFPB Open DataLearning rebuild
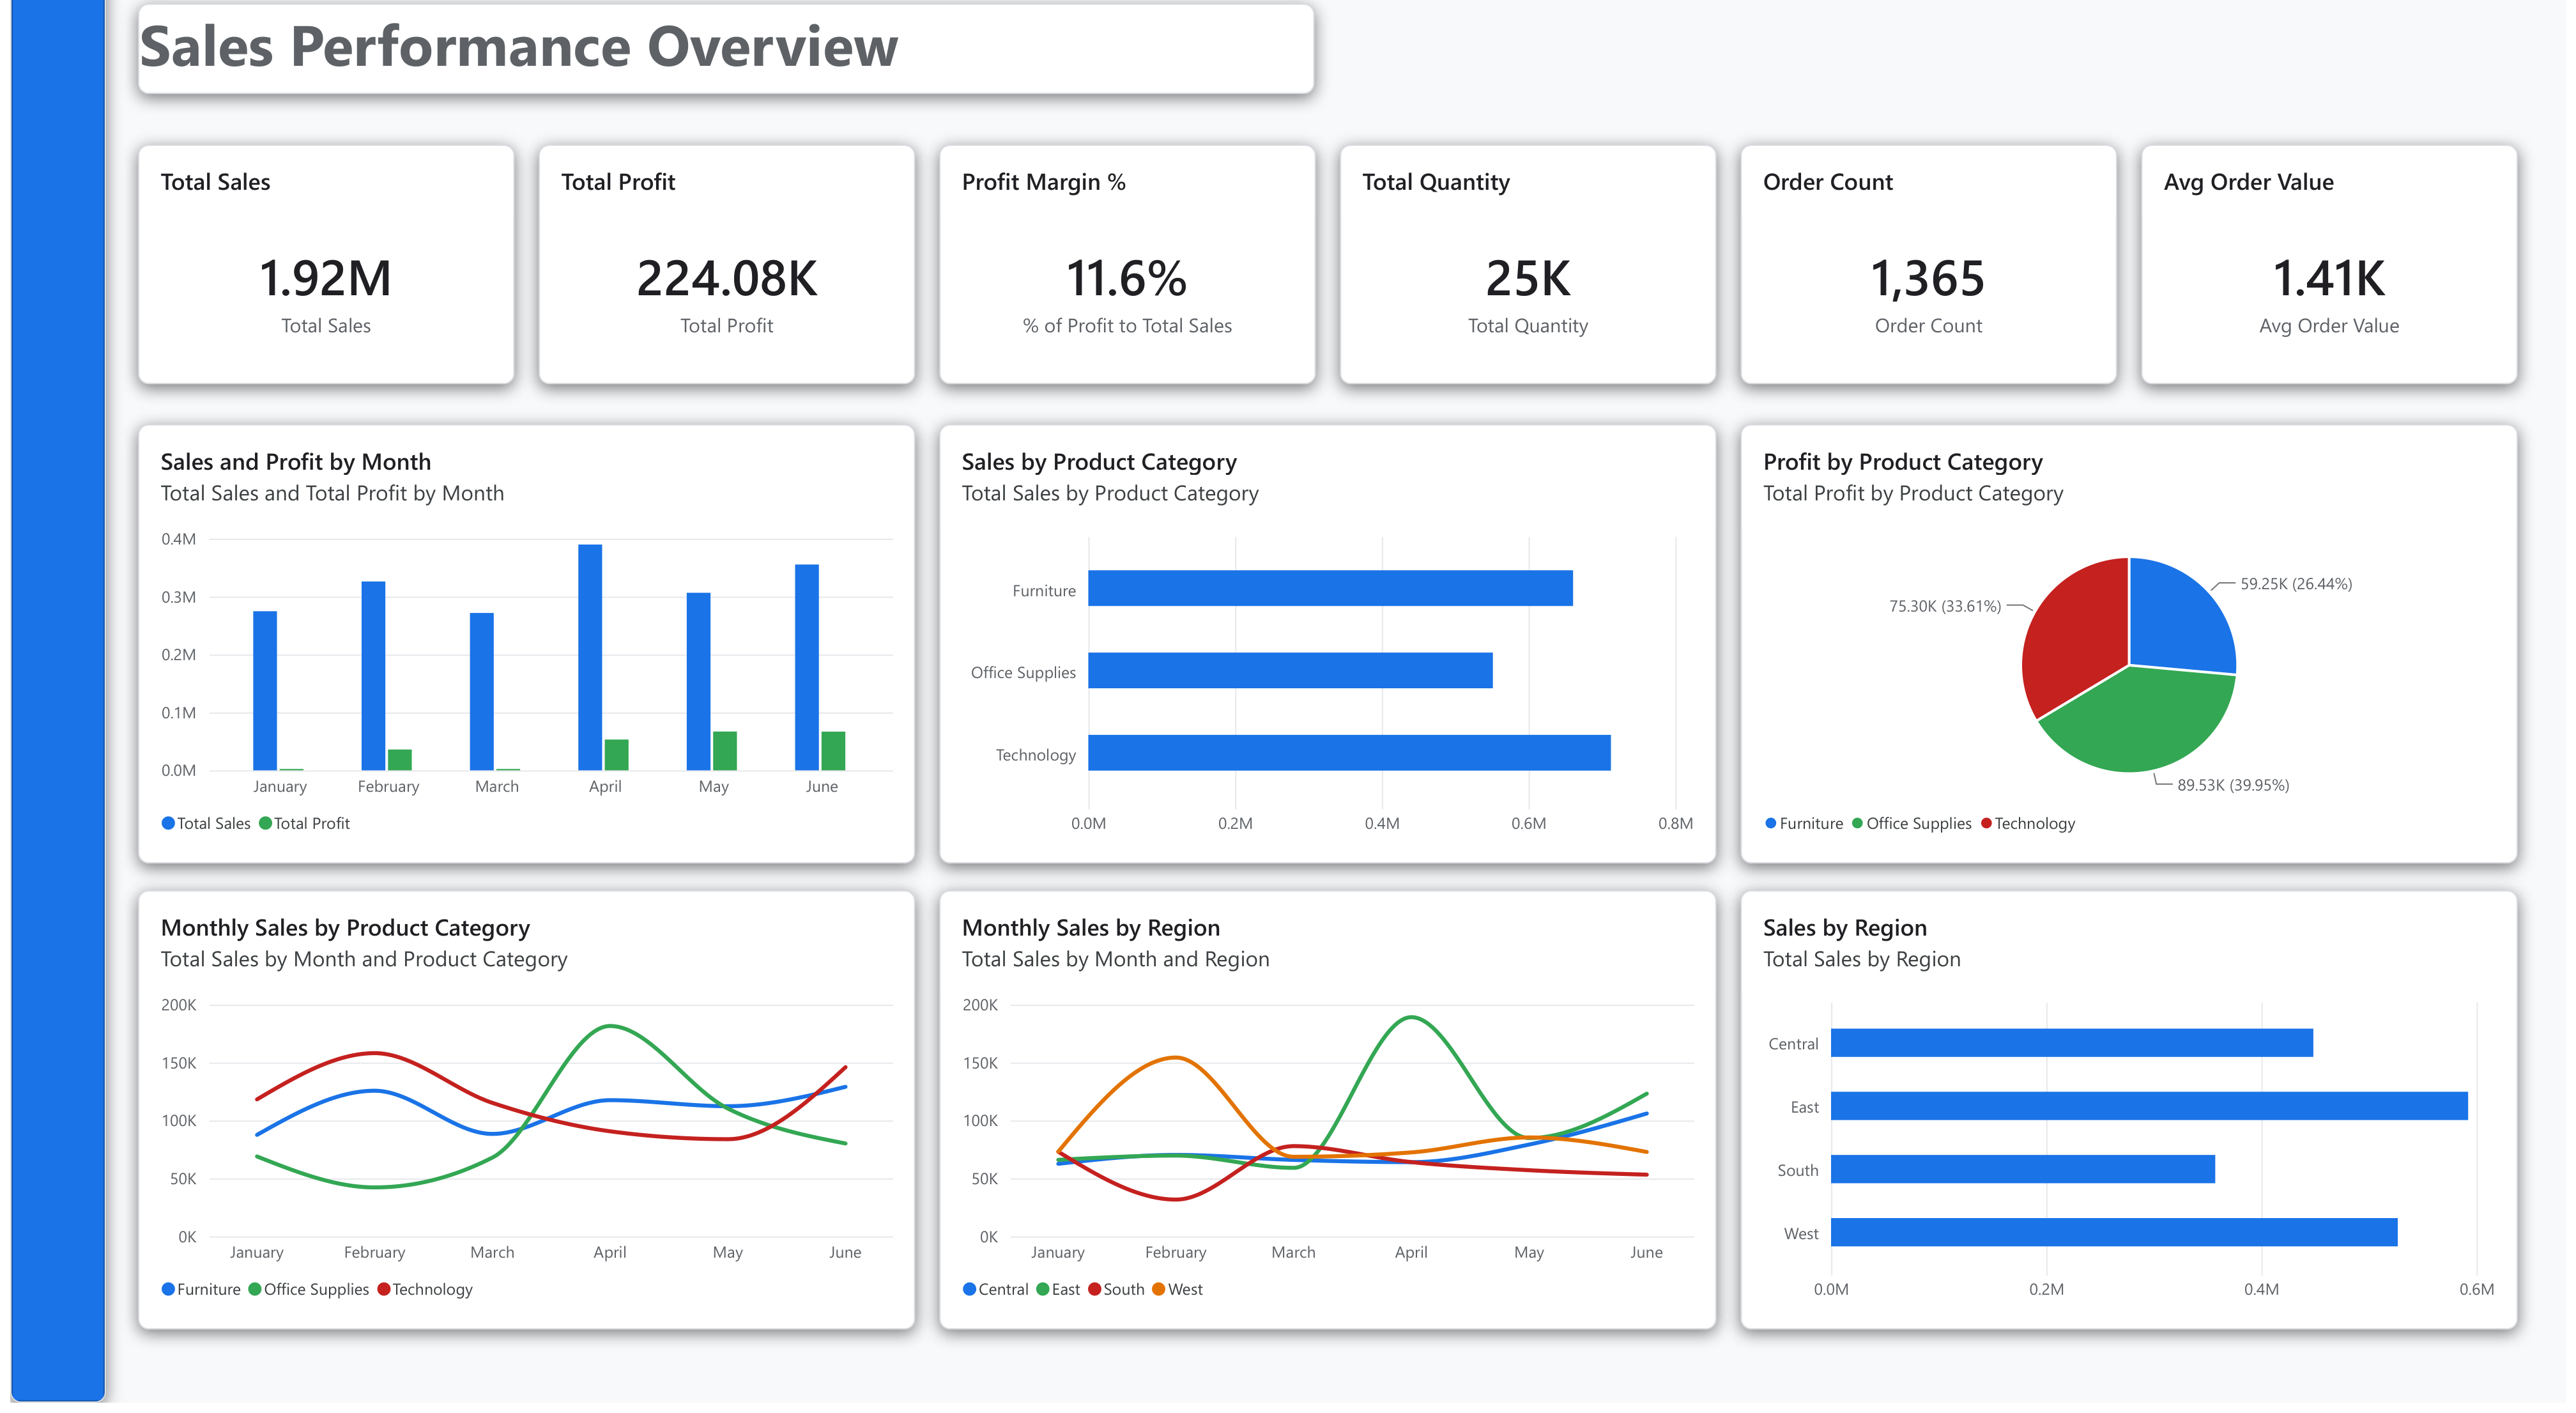
Power BI dashboard titled Sales Performance Overview, showing six KPI cards for total sales, profit, margin, quantity, order count and average order value, above charts breaking sales and profit down by month, product category and region. View full size

Sales Performance Overview

The question: which categories and regions actually make money, rather than just moving volume?

Built from an empty file rather than an image. Six KPI cards — 1.92M in sales, 224.08K profit, an 11.6% margin across 1,365 orders — over breakdowns by month, product category and region. The overview page shown here is one of seven, all carrying a custom corporate theme I built and applied across the report.

What it surfaces: Technology sells the most, but Office Supplies earns the most — 89.53K of profit against Technology's 75.30K. A sales total alone hides that completely.

Power BIDAXCustom Theme7 pagesBuilt from scratch
Download the .pbix and extend it
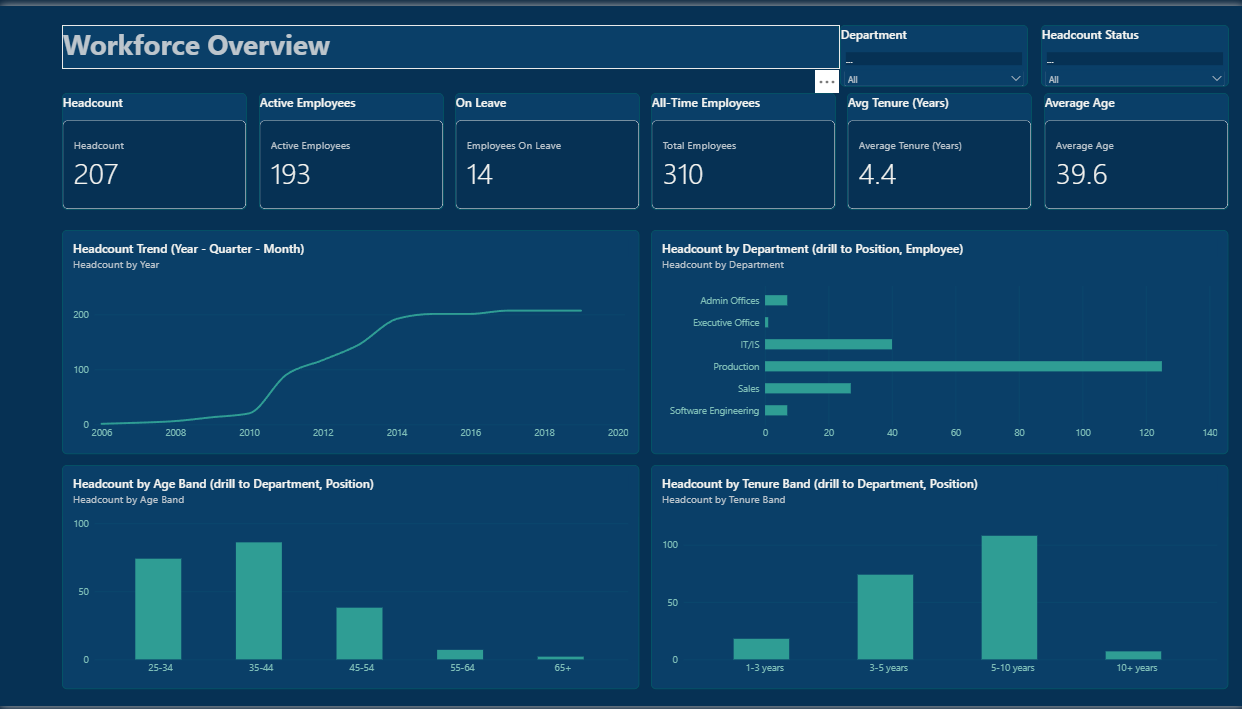
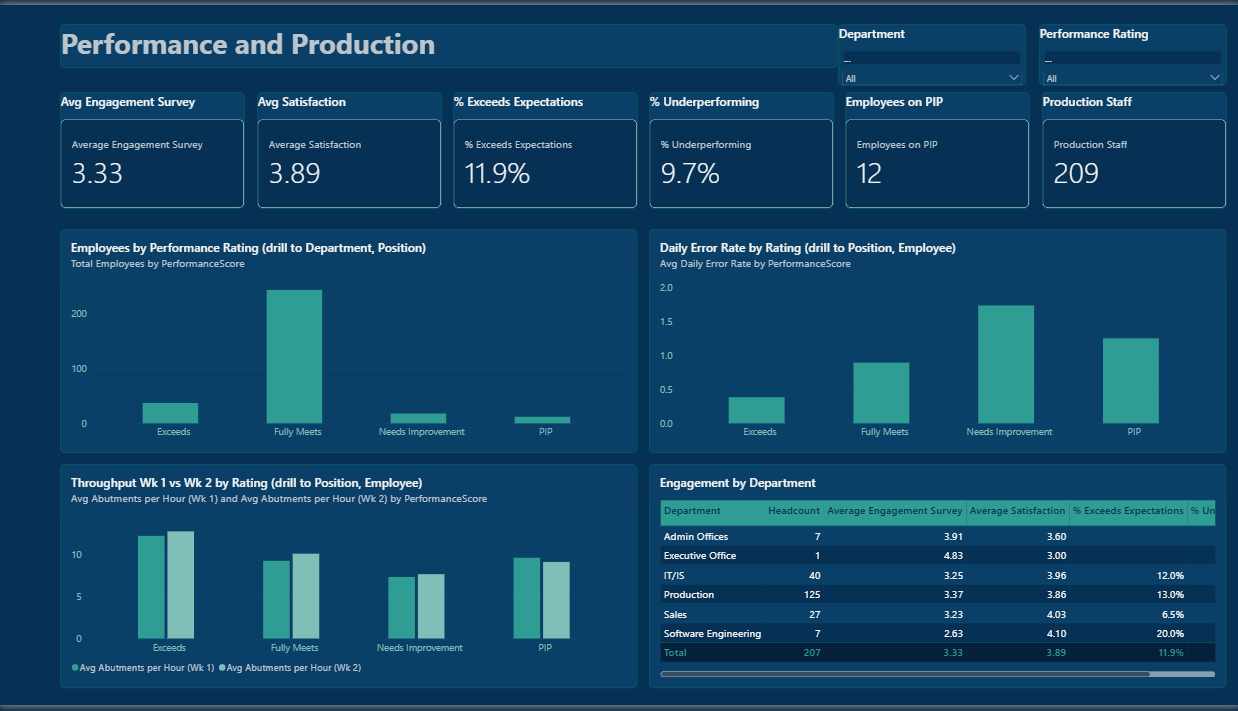
Power BI dashboard titled Workforce Overview on a dark navy and teal theme, showing KPI cards for headcount 207, active employees 193, on leave 14, all-time employees 310, average tenure 4.4 years and average age 39.6, above a headcount trend line from 2006 to 2020, headcount by department, and distributions by age band and tenure band. View full size

HR Analytics — Workforce, Attrition & Pay

The question: who is leaving, how early, and what is it costing us to replace them?

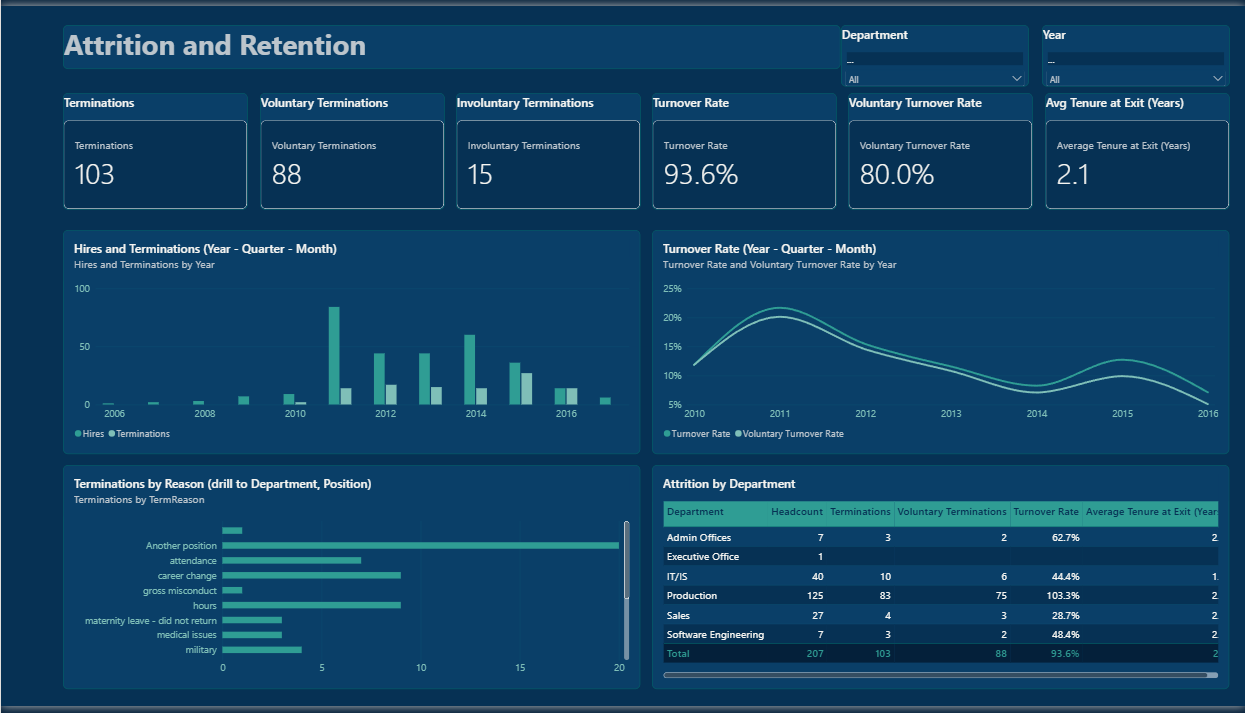
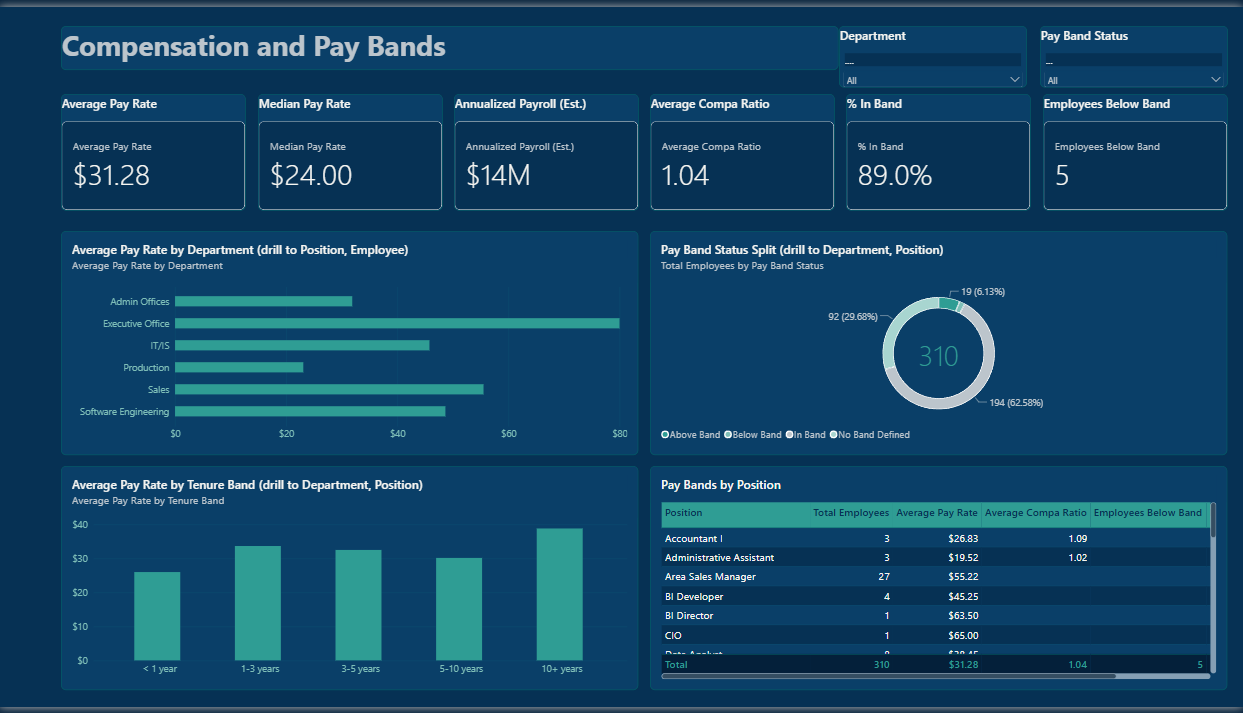
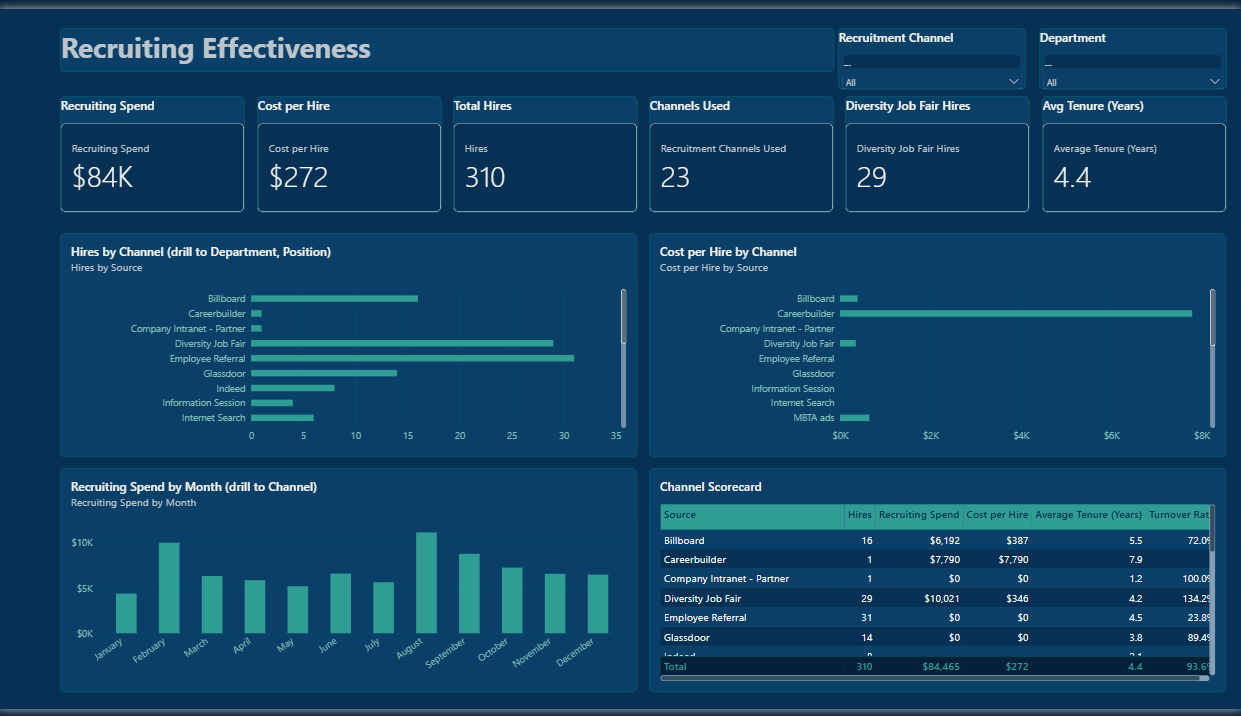
Built from six raw CSV extracts on a public sample HR dataset of 310 employees — no client data. Five pages, 30 KPI cards, 16 charts and 4 tables over a nine-table model with 48 documented measures: workforce overview, attrition and retention, compensation and pay bands, recruiting effectiveness, and production performance.

What it surfaces: average tenure at exit is 2.1 years against 4.4 years across the whole population — people are not leaving late, they are leaving early. And the blended $272 cost per hire hides a range from roughly $507 to $7,790 depending on the channel, so the headline number is the one figure you should never present on its own.

The one that mattered: the source's own EmploymentStatus field labels eleven people "Future Start" who were hired in 2015 and 2016 and have completed performance reviews. Any headcount built on that field is quietly short by eleven. Every measure here is built on a derived status column instead, and the reason is written down in the model documentation rather than living in my head.

Power BIPower QueryDAXStar Schema5 pages48 measuresBuilt from scratch
Download the .pbix and the documentation

On provenance. The complaints dashboard is a learning rebuild of work by Somel Eraño Chan, reconstructed from a screenshot of their published case study on the public CFPB consumer complaint database. The design and the analysis are theirs; only the reconstruction is mine, and I am showing it because how it was rebuilt is the point, not who thought of it. The sales and HR reports were both built from scratch on public sample data. No client data appears in any of them.

Free Tools

Take them. That's the point.

Eleven files, all free. I ask for your email once, on the first download — after that the rest come without asking again. No payment, no trial, no drip sequence. If one of them saves you a week, that is the entire return I am after.

Payroll & Excel systems

6 workbooks

Formula-driven and macro-free. Open in Excel, LibreOffice or Google Sheets.

XLSX3.6 MB
Payroll SystemPHP

Philippine Payroll Template — Full Workbook

The one I actually use. Nineteen sheets covering a whole cutoff: payroll register, payslips, SSS / PhilHealth / Pag-IBIG reports, BIR 1601-C, 13th month, bank file, and an audit check that flags anything failing to reconcile. The 2026 statutory tables sit on their own visible tab, so you can see what every deduction rests on.

  • Payroll Register
  • Payslip
  • SSS / PhilHealth / Pag-IBIG
  • BIR 1601-C
  • 13th Month
  • Audit & Controls
Download workbook
XLSX336 KB
Reporting PackPHP

Dental Practice — Monthly Financial Reporting Pack

24 monthly periods from a single trial-balance input. Tracks chairs, dentist FTE, patient visits and operating days alongside the full statement set.

  • TB Input
  • P&L Monthly
  • Balance Sheet
  • Variance
  • KPI Dashboard
  • Checks
Download workbook
XLSX319 KB
Reporting PackUSD

Café, Coffee Shop & Bar — Monthly Financial Reporting Pack

Built around seats, trading days, labour hours, drinks sold, tickets and delivery orders — the drivers that actually explain a beverage P&L.

  • TB Input
  • P&L Monthly
  • Balance Sheet
  • Variance
  • KPI Dashboard
  • Checks
Download workbook
XLSX321 KB
Reporting PackUSD

Restaurant & Mobile Food Service — Monthly Financial Reporting Pack

Covers, tickets, labour hours, delivery orders and service locations, with every line tested against your own materiality thresholds.

  • TB Input
  • P&L Monthly
  • Balance Sheet
  • Variance
  • KPI Dashboard
  • Checks
Download workbook
XLSX230 KB
Reporting PackUSD

Beauty Salon, Barbershop & Wellness — Monthly Financial Reporting Pack

Stations, service hours, client visits, new clients and locations feed the KPI dashboard, so utilisation and retention sit next to the numbers.

  • TB Input
  • P&L Monthly
  • Balance Sheet
  • Variance
  • KPI Dashboard
  • Checks
Download workbook
XLSX565 KB
Operations SystemPHP / USD

Swimwear Retail Operations System

A complete multi-store inventory and sales engine — allocations, receiving, sales, returns and live stock on hand per store, with sell-through and reorder alerts.

  • Dashboard
  • Store Inventory
  • Sell-Through
  • Best Sellers
  • Movement Log
  • Low Stock Alerts
Download workbook

Power BI reports & themes

5 files

Two complete .pbix reports on public sample data, the model write-up behind one of them, and the two themes they use.

PBIX389 KB
Power BI ReportFree

Sales Performance — Full Power BI Report

The whole file, not a screenshot. Seven pages, 48 measures and the corporate theme already applied — open it in Power BI Desktop and read every piece of DAX behind it. Built on the standard sample sales dataset, so nothing here is anyone's real data.

Deliberately unfinished. Past the overview, most pages carry only a KPI row and two visuals. That is on purpose — the model, the measures and the theme are the slow part and they are done, so you can drop your own charts onto a blank canvas and find out what 48 measures will give you. Learning Power BI by extending a working file beats starting from an empty one.

  • 7 pages
  • 48 measures
  • Orders + Calendar
  • Theme included
  • Built to extend
Download the .pbix
PBIX318 KB
Power BI ReportFree

HR Analytics — Full Power BI Report

A finished five-page HR report on a public sample dataset of 310 employees: workforce overview, attrition and retention, compensation and pay bands, recruiting effectiveness, production performance. Nine tables, six relationships, twelve derived columns and 48 measures, with the dark theme already applied.

The interesting part is the model, not the charts. Six messy CSVs go in — padded whitespace, currency stored as text, a two-row stacked header, twelve month columns needing unpivoting, three files describing the same people — and one defensible star schema comes out. Open it in Power BI Desktop and every Power Query step and every measure is readable.

  • 5 pages
  • 48 measures
  • 9 tables
  • Theme included
  • Sample data only
Download the .pbix
DOCX25 KB
DocumentationFree

HR Model — Data Prep & DAX Documentation

The write-up behind the report above. Every source file and why it was loaded, every cleaning step and what it would have broken, all twelve derived columns, all six relationships, and all 48 measures with their exact DAX and a plain-language explanation of what each one is for.

Read the last section first. It lists every data-quality defect found while validating against live data — the field that is entirely empty, the status column that undercounts headcount by eleven, the turnover rate that is meaningless as a card, the cost file with no year in it. A model you can trust is one whose faults are written down.

  • 13 sections
  • 48 measures
  • Full DAX
  • Data quality notes
  • Useful on its own
Download the write-up
JSON12 KB
Power BI ThemeFree

Corporate Light — Power BI Theme

The theme behind the sales report above. A Material-style palette with the parts most themes leave out: defined good, bad and neutral states so conditional formatting inherits correctly, a proper foreground colour, and a table accent — rather than everything defaulting to Power BI blue.

  • 8 data colours
  • good / bad / neutral
  • Light background
  • View › Themes › Browse
Download theme
JSON107 KB
Power BI ThemeFree

Lagoon Dark — Power BI Theme

The theme on the HR report above. A deep navy canvas with teal accents, and — the reason it exists — text sized to be read rather than admired: 34pt KPI callouts, 15pt titles, 12pt labels. Most dark themes are dark and illegible; this one was tuned against a real five-page report until every number could be read from across a desk.

  • Dark canvas #063154
  • 48 visual types styled
  • Large-text sizing
  • good / bad / neutral
  • View › Themes › Browse
Download theme

Before you use these. In the workbooks, blue cells are yours to fill and black cells are formulas that will break if you type over them; each one opens on a Start Here tab with a five-step setup and carries a Licence tab with the full terms. The themes are plain JSON files — in Power BI Desktop, View › Themes › Browse for themes. These are templates, not accounting, audit or tax advice — have anything you circulate reviewed by your accountant.

Impact

What it changed — starting with me

Speed is only interesting because of what it gives back. This section is deliberately thin: it is four weeks in, and I would rather show one account I can stand behind than three I wrote on someone else's behalf.

The first person it changed

Me — senior finance manager, Philippines

For years the fixes I could see stayed as requirements documents and business cases that never cleared the threshold. Not one of them became something a person could actually open. The constraint was never the idea — it was that specifying software and building it are different jobs, and I only had one of them.

Four weeks after opening Claude for the first time, everything above this line exists: two payroll calculators, five spreadsheet systems, three Power BI reports and this site. Most of it free. None of it waiting on anyone's budget cycle.

Before · nothing I could hand to anyone
After · eleven tools in thirty-one days

The accounts that matter more than mine are the ones I do not have yet — what changed for the people using these tools. As they tell me, they go here, in their words rather than mine. If something on this page saved you time, I would genuinely like to hear about it.

Work With Me

If the free tools are close but not quite yours

Everything above is free because most businesses need the same eighty percent. The remaining twenty is where your business is actually different — and that part has to be built for you.

Power BI Dashboards & Reporting

For businesses that have the data and no visibility into it. I build the model underneath as carefully as the dashboard on top, because a pretty chart over a bad model is worse than no chart.

  • Data model and star schema design
  • DAX measures, documented in plain language
  • KPI dashboards your team can actually read

Custom Excel Systems

Workbooks built around how your business actually runs, not a template you have to bend yourself around. Formula-driven, macro-free, and documented so it survives you handing it to someone else.

  • Reporting packs and month-end close systems
  • Inventory, allocation and operations trackers
  • Integrity checks so errors surface early

Payroll & Bookkeeping Setup

The discipline I built my career on, and still the work I am most careful with. Getting payroll right the first time is far cheaper than correcting two years of it later.

  • Payroll setup with current statutory tables
  • Books cleanup and a repeatable monthly close
  • Contribution and remittance review

Custom Tools & Automation

Calculators, internal tools and small web apps — the thing this whole page is evidence I can do. If you can describe the problem clearly, that is genuinely enough to start.

  • Browser-based calculators and internal tools
  • Automating the report you rebuild every month
  • Process documentation so it outlives the tool

Tell me what you are stuck on.

No forms, no discovery call funnel. Describe the problem in a paragraph and I will tell you honestly whether I am the right person for it — and if a free template already solves it, I will point you there instead.

Or write directly: ceo@tabulanceph.com

What I Learned

The parts that don’t fit on a poster

If this page only told you it was fast and easy, you would be right not to trust it. Four things I would want to know before starting.

On expertise

It raises your ceiling. It does not replace your floor.

Every tool here is good because I already knew what a correct answer looked like. Someone who did not understand payroll would have produced something that ran perfectly and was wrong in ways nobody would notice until an audit. Years of finance judgment did not become less valuable — it became the thing that decides whether the speed helps you or hurts you.

On the real work

The bottleneck moved. It didn’t disappear.

Building stopped being the slow part, so the slow part became deciding what to build and verifying what came back. I spend far less time making things and considerably more time checking them. That is a good trade, but it is a trade, and anyone who tells you the checking step is optional has not shipped anything that mattered.

On being wrong

Confident and wrong is the failure mode to plan for.

The mistakes that cost me time were never obvious errors — they were reasonable-looking output built on an assumption I had not stated. The fix is boring and it works: test against something real, build in pieces you can check, and treat anything you have not personally verified as unverified, however good it looks.

On the point of it

The best outcome isn’t a tool. It’s someone not needing you.

The work I am proudest of is the workbook a client now runs without calling me, and the calculator someone found at eleven at night and used without ever knowing who made it. Capability that only lives with the person who built it is not much of a gift. Give it away properly and it keeps working after you have left the room.

Contact

Four weeks ago I couldn’t build any of this.

If you are earlier on this road than I am, take the tools and the method — both are free. If you have a problem you can describe, that is enough to start a conversation.

ceo@tabulanceph.com